Fuel cells
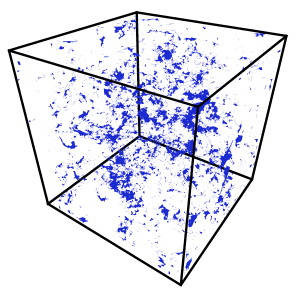
We are interested in understanding and predicting the spatio-temporal evolution of morphologies, deformation, and damage in multiphase, multicomponent materials for energy conversion and storage under extended use. In particular, we have focused our efforts on solid-oxide fuel cell anodes, which are complex and evolving mixtures of ceramic and metallic components. The animation above shows a typical sequence of steps during the coarsening process of an initially homogeneous metallic wetting layer covering the oxide backbone, while the images below demonstrate the processing techniques that we have developed to numerically produce model composite structures that mimic the microstructures of modern fabrication techniques.

Using these three-dimensional scaffold structures and phase field modeling, we can numerically simulate the type of microstructural evolution that is experienced by catalytic materials during high-temperature operation. The renderings below show a catalyst material (orange) that has been infiltrated into the scaffold system. At high temperatures, the diffusivity of the catalyst increases sufficiently to result in a microstructural rearrangement, which includes surface dewetting and coarsening processes. This leads to the long-term degradation of the anode material and eventually to complete deactivation of the fuel cell. [R. Davis and M. Haataja. Journal of Power Sources 369 (2017)]

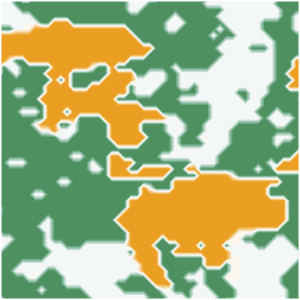
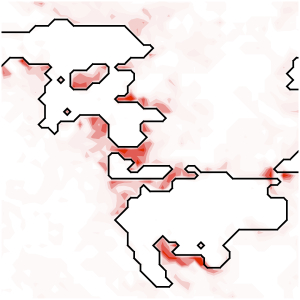
The figures below display continuum simulations of stress evolution and damage accumulation due to redox reaction in a Solid Oxide Fuel Cell anode (Ni-YSZ). In the figures below, the Ni phase is shown in orange, YSZ in green, and pore phase in white. Leftmost panel: experimentally obtained Ni-YSZ microstructure employed in the simulations. Panel 2nd from left: spatial distribution of accumulated damage during stress evolution. Panel 2nd from right: two-dimensional cross-section of microstructure. Rightmost panel: regions of large tensile stress within the YSZ phase are localized within highly constrained YSZ domains. [F. Abdeljawad, G. J. Nelson, W. K. S. Chiu, and M. Haataja. Journal of Applied Physics 112, 036102 (2012)]